
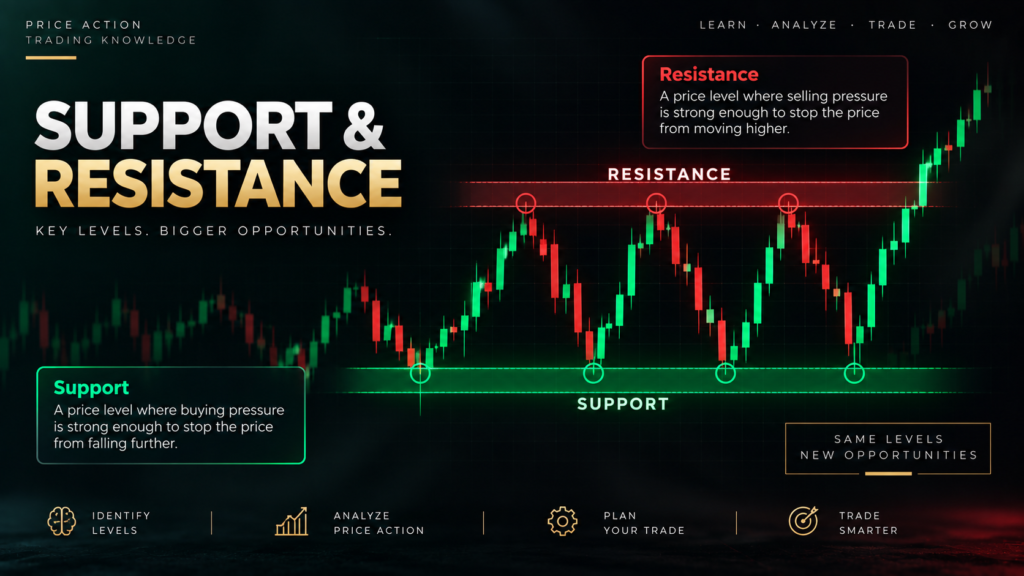
In technical analysis, support and resistance are two fundamental concepts used to understand how price behaves at important levels on a chart.
Markets rarely move in a perfectly straight line. Price tends to move up and down, pause around certain areas, and sometimes reverse direction. Support and resistance help traders identify these areas and study how the market has reacted to them in the past.
What Is Support?
Support is a price level or zone where selling pressure has previously weakened and buying interest has emerged strongly enough to slow or temporarily stop a decline.
Imagine a stock falling from ₹500 to ₹450. If the price repeatedly finds buying interest around ₹450 and moves upward from that area, ₹450 may be considered a support level.
Simply put:
Support is an area where demand has historically been strong enough to prevent or slow further price declines.
Example
Suppose a stock behaves like this:
₹500 → ₹470 → ₹450 → ₹480 → ₹450 → ₹490
The repeated reaction around ₹450 suggests that market participants have previously shown interest around that area.
However, support is not a guaranteed floor. If selling pressure becomes strong enough, price can move below it.
What Is Resistance?
Resistance is a price level or zone where buying pressure has previously weakened and selling interest has emerged strongly enough to slow or temporarily stop an advance.
For example, if a stock repeatedly rises toward ₹600 but struggles to move above that area, ₹600 may be considered a resistance level.
Simply put:
Resistance is an area where selling pressure has historically been strong enough to prevent or slow further price increases.
Example
Imagine:
₹500 → ₹550 → ₹600 → ₹570 → ₹600 → ₹580
The repeated reaction around ₹600 indicates that this area has acted as resistance.
Again, resistance is not an absolute ceiling. Price can eventually break above it.
Support vs Resistance
| Support | Resistance |
|---|---|
| Located below the current price | Located above the current price |
| Associated with buying interest | Associated with selling interest |
| Can slow a decline | Can slow an advance |
| Price may bounce upward | Price may move downward |
| Can eventually break | Can eventually break |
How Are Support and Resistance Created?
Support and resistance can develop because of repeated market reactions.
Some common factors include:
1. Previous Highs and Lows
Previous turning points can become important reference areas.
A previous low may later act as support, while a previous high may act as resistance.
2. Psychological Price Levels
Some prices attract attention because they are easy to remember.
Examples include:
₹100, ₹500, ₹1,000, ₹2,000
These are sometimes called round-number levels or psychological levels.
3. High-Volume Areas
Areas where significant trading activity has occurred can become important because many market participants may have positions around those prices.
4. Trendlines
A trendline connecting successive price lows or highs can sometimes function as dynamic support or resistance.
5. Moving Averages
Certain moving averages are commonly monitored by technical analysts and can sometimes behave as dynamic support or resistance.
However, their significance depends on the asset, timeframe, and market conditions.
Support and Resistance Are Usually Zones
One of the most important ideas for beginners is that support and resistance are not always exact prices.
For example, instead of saying:
“₹500 is support.”
It can be more appropriate to think:
“The ₹490–₹505 area has previously attracted buying interest.”
Why?
Because markets are made up of many different orders and participants. Price does not necessarily reverse at precisely the same number every time.
Therefore, support and resistance zones can often provide a more realistic representation of market behaviour.
What Happens When Support Breaks?
When price moves decisively below an established support area, traders often refer to this as a support breakdown.
For example:
Support: ₹500
If price moves:
₹530 → ₹510 → ₹500 → ₹490 → ₹475
the market has moved below the previously observed support area.
A broken support level can sometimes later become resistance.
This phenomenon is commonly called a role reversal.
What Happens When Resistance Breaks?
When price moves decisively above an established resistance area, it is commonly described as a resistance breakout.
For example:
Resistance: ₹600
Price moves:
₹550 → ₹580 → ₹600 → ₹610 → ₹625
The market has moved above the previous resistance area.
In some situations, the previous resistance can later act as support if price returns to that area.
This is another example of role reversal.
Support and Resistance in an Uptrend
During an uptrend, price generally forms a sequence of higher highs and higher lows.
A previous resistance area may be broken and subsequently become a potential support zone.
For example:
Resistance → Breakout → Retest → Support
This behaviour is often studied by technical analysts when examining market structure.
Support and Resistance in a Downtrend
During a downtrend, price generally forms lower highs and lower lows.
Previous support areas can sometimes become resistance after being broken.
A simplified structure could look like:
Support → Breakdown → Retest → Resistance
Again, this is not guaranteed to happen in every market.
How to Identify Support and Resistance
When studying a chart, look for areas where price has repeatedly:
- Reversed direction
- Stopped advancing
- Stopped declining
- Consolidated
- Reacted strongly
- Created previous highs or lows
Instead of looking at one isolated candle, examine the surrounding price structure.
A level that has produced several meaningful reactions may deserve more attention than a level that price touched only once.
Support, Resistance and Volume
Volume can provide additional context when studying important price levels.
For example, a breakout above resistance accompanied by comparatively high trading volume may indicate greater participation than a breakout occurring on very low volume.
However, volume should not be interpreted independently. Price structure, liquidity, timeframe, and the characteristics of the particular market also matter.
Common Mistakes Beginners Make
1. Treating Support as a Guaranteed Floor
Support can fail. A price level should not be treated as an absolute barrier.
2. Treating Resistance as an Unbreakable Ceiling
Resistance can be broken when buying pressure becomes strong enough.
3. Drawing Too Many Levels
Marking every small price movement as support or resistance can make a chart difficult to interpret.
Focus on meaningful areas rather than every minor fluctuation.
4. Ignoring the Larger Trend
A support level on a short-term chart may have limited significance when compared with a major level on a higher timeframe.
5. Looking Only at Exact Numbers
Markets often react around zones rather than precisely at one price.
Support and Resistance Across Timeframes
Support and resistance can appear on virtually any timeframe.
For example:
- 5-minute chart: Short-term levels
- 1-hour chart: Intraday or short-term structure
- Daily chart: Larger market structure
- Weekly chart: Major long-term levels
A level visible on a weekly chart may represent a much broader area of historical price interaction than a level visible only on a 5-minute chart.
This is why multiple-timeframe analysis can provide additional context.
A Simple Example
Imagine a stock trading around ₹800.
Over several weeks:
- Price falls toward ₹750 and rises.
- Price falls toward ₹752 and rises.
- Price falls toward ₹748 and rises.
The ₹748–₹752 area could be considered a support zone based on those historical reactions.
Later, suppose price rises toward ₹850 several times but struggles to move higher.
The ₹850 area could be considered a resistance zone.
The chart can therefore be simplified as:
Resistance → ₹850
⬆️ Price moves between the levels
Support → ₹750
The interaction between these areas can help describe the stock’s current trading range.