
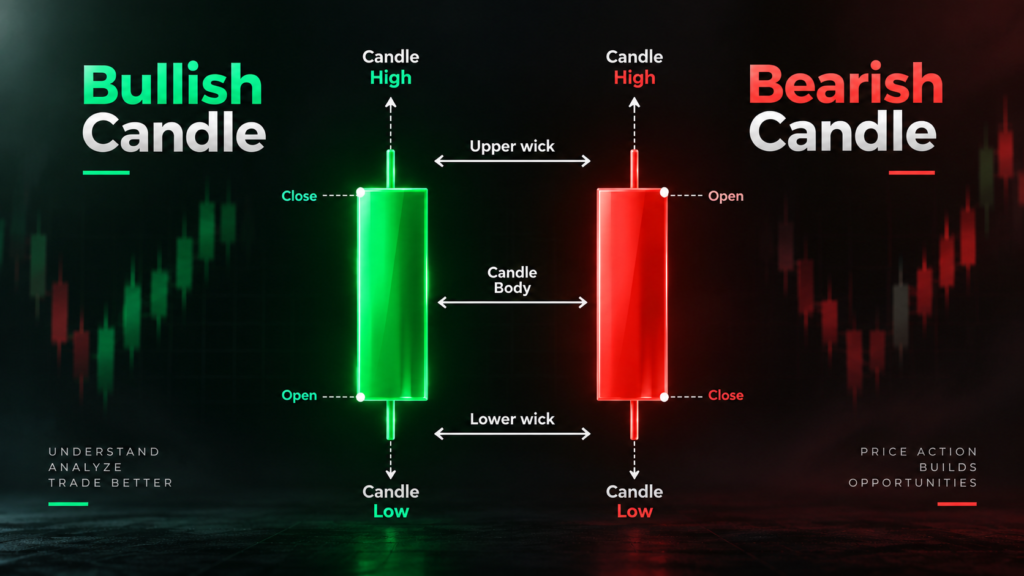
Candlestick charts are one of the most widely used ways to visualize price movements in financial markets. A single candlestick can show how the price of an asset behaved during a specific period, including where it opened, where it closed, and the highest and lowest prices reached.
For traders studying price action and technical analysis, candlesticks provide a visual way to examine market behaviour and identify patterns.
What Is a Candlestick?
A candlestick represents the price movement of an asset over a specific period.
Depending on the selected timeframe, one candle could represent one minute, one hour, one day, one week, or another period.
Every standard candlestick contains four important price points:
- Open – The price at the beginning of the period
- High – The highest price reached during the period
- Low – The lowest price reached during the period
- Close – The price at the end of the period
These four values are commonly referred to as OHLC data.
Basic Structure of a Candlestick
A candlestick consists of two main components:
1. Body
The body represents the distance between the opening and closing prices.
2. Wicks or Shadows
The lines extending above and below the body represent the highest and lowest prices reached during that period.
Bullish and Bearish Candles
Candlesticks are commonly displayed using two contrasting colours.
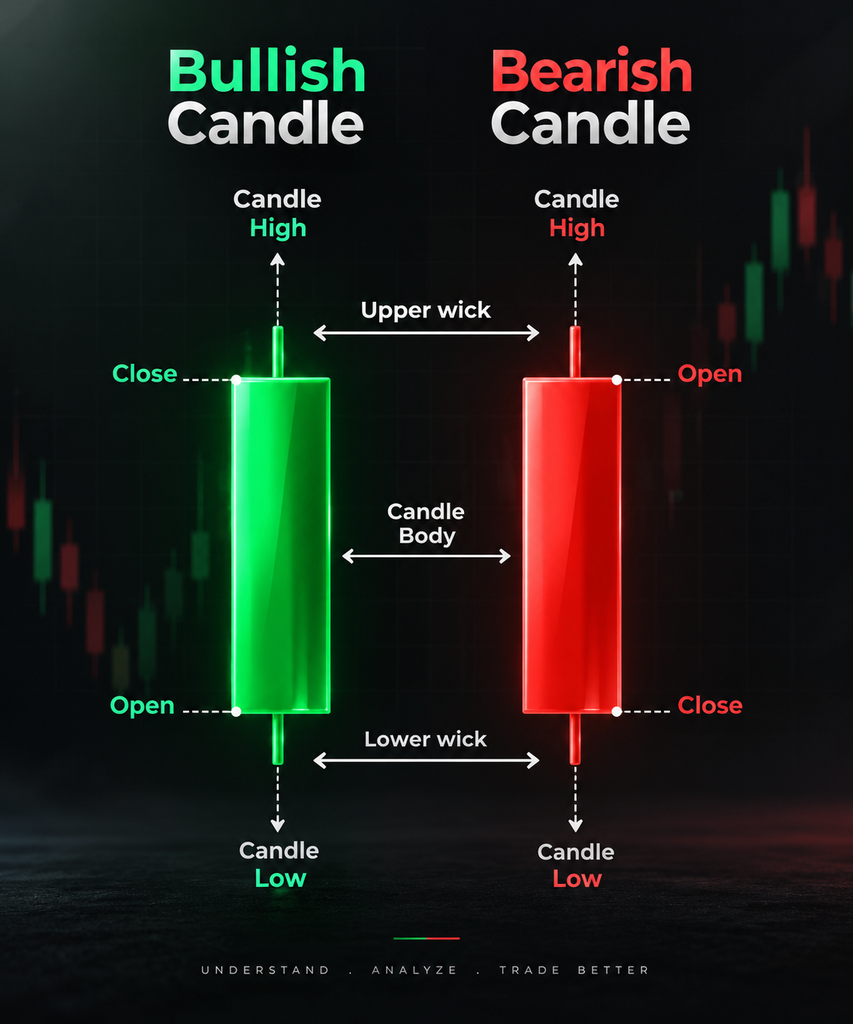
🟢 Bullish Candle
A bullish candle forms when:
Close > Open
This means the price finished the period higher than where it started.
For example:
Open: ₹500
Close: ₹530
The candle indicates that the price increased by ₹30 during that period.
🔴 Bearish Candle
A bearish candle forms when:
Close < Open
For example:
Open: ₹530
Close: ₹500
The price declined by ₹30 during the period.
The exact colours can vary depending on the charting platform. What matters is the relationship between the open and close.
What Does the Candle Body Tell Us?
The size of the body provides information about the distance between the opening and closing prices.
Large Body
A relatively large body indicates a substantial movement between the open and close.
It can suggest strong directional price movement during that period, although it should not be interpreted in isolation.
Small Body
A small body means the opening and closing prices were relatively close.
This can occur when there is greater balance between buying and selling pressure during that period.
Understanding the Wicks
The upper and lower wicks show how far the price travelled beyond the candle’s opening and closing range.
Long Upper Wick
A long upper wick means the price moved considerably higher during the period but later moved back down.
Depending on the surrounding market structure, this can indicate rejection of higher prices.
Long Lower Wick
A long lower wick means the price moved considerably lower but subsequently recovered.
Depending on context, this can indicate rejection of lower prices.
The important point is that a wick by itself does not tell the complete story. Its meaning can change depending on the trend, support and resistance levels, volume, and surrounding candles.
Why Are Candlesticks Important?
Candlesticks allow traders to see more than simply whether price increased or decreased.
Consider these two situations:
Stock A:
Open ₹100 → Close ₹105
Stock B:
Open ₹100 → High ₹115 → Low ₹95 → Close ₹105
Both stocks finished at ₹105, but their intraperiod behaviour was very different.
A simple price change shows a ₹5 increase. The candlestick reveals the journey the price took to reach that closing price.
This is one reason candlestick charts are useful for studying price action.
Common Candlestick Patterns
Individual candles and combinations of candles can form recognisable patterns.
Some commonly discussed patterns include:
1. Doji
A Doji generally occurs when the opening and closing prices are very close.
It can represent a period of uncertainty or relative balance between buyers and sellers.
2. Hammer
A Hammer has a relatively small body and a comparatively long lower wick.
When it appears after a decline, traders may study it as a potential indication of rejection of lower prices. Its significance depends heavily on context and confirmation.
3. Shooting Star
A Shooting Star typically has a small body and a long upper wick.
When appearing after an advance, it can indicate that higher prices were rejected during that period.
4. Engulfing Patterns
An engulfing pattern involves two candles where the second candle’s body substantially covers the previous candle’s body.
Two commonly discussed forms are:
- Bullish Engulfing
- Bearish Engulfing
These patterns are often studied in combination with the existing trend and nearby price levels.
Candlestick Patterns Should Not Be Read Alone
One of the biggest mistakes beginners make is treating a candlestick pattern as an automatic buy or sell signal.
A candle is simply a representation of price behaviour.
Its interpretation can change depending on:
- Market trend
- Support and resistance
- Trading volume
- Volatility
- Timeframe
- Market structure
- Previous price action
- Broader market conditions
For example, a hammer appearing randomly in the middle of a sideways market may have a different significance from a hammer appearing near an established support level after a sustained decline.
Context gives the candle meaning.
Candlesticks Across Different Timeframes
The same asset can produce completely different candles depending on the timeframe.
For example:
1-minute chart → Each candle represents one minute.
15-minute chart → Each candle represents fifteen minutes.
1-hour chart → Each candle represents one hour.
Daily chart → Each candle represents one trading day.
Weekly chart → Each candle represents one week.
A pattern visible on a short timeframe may not appear in the same way on a longer timeframe.
This is why traders often examine multiple timeframes when studying price behaviour.
Candlesticks and Price Action
Price action refers to the study of price movement itself rather than relying exclusively on technical indicators.
Candlesticks form an important part of price-action analysis because they help traders examine:
- Direction of movement
- Momentum
- Rejection
- Consolidation
- Breakouts
- Reversals
- Market structure
Instead of asking only “Is the candle green or red?”, a deeper analysis asks:
What happened during the candle, and what does that behaviour tell us about the market?
Candlesticks vs Line Charts
A line chart generally connects closing prices over time.
A candlestick chart provides considerably more information for each period because it displays:
Open + High + Low + Close
For example:
| Feature | Line Chart | Candlestick Chart |
|---|---|---|
| Closing price | ✓ | ✓ |
| Opening price | Usually not shown | ✓ |
| Highest price | Usually not shown | ✓ |
| Lowest price | Usually not shown | ✓ |
| Price range | Limited | Clearly visible |
| Candle patterns | ✗ | ✓ |
This makes candlestick charts particularly useful when studying short-term price behaviour and technical analysis.