
Before studying advanced technical analysis, it is important to understand one of the most fundamental ideas in trading: market structure.
Price does not move randomly in a perfectly straight line. It creates a sequence of highs and lows, and the relationship between these points helps us understand whether a market is generally moving upward, downward, or sideways.
Understanding trend and market structure allows traders to read the behaviour of price rather than looking at individual candles in isolation.
What Is a Trend?
A trend is the general direction in which the price of an asset is moving over a particular period.
There are three basic types of trends:
- Uptrend
- Downtrend
- Sideways or range-bound market
The trend can differ depending on the timeframe being studied. A stock can be in an uptrend on a daily chart while simultaneously experiencing a short-term downtrend on a 15-minute chart.
1. Uptrend
An uptrend occurs when price generally forms a sequence of:
Higher Highs (HH)
Higher Lows (HL)
A simplified structure looks like:
Higher High → Higher Low → Higher High → Higher Low
For example:
₹500 → ₹550 → ₹525 → ₹580 → ₹550 → ₹620
Here, the market is creating progressively higher highs and higher lows.
This structure indicates that price is generally moving upward.
What Are Higher Highs?
A Higher High (HH) occurs when a new swing high forms above the previous significant swing high.
What Are Higher Lows?
A Higher Low (HL) occurs when a new swing low forms above the previous significant swing low.
Together, these create the basic structure of an uptrend.
2. Downtrend
A downtrend occurs when price generally forms:
Lower Highs (LH)
Lower Lows (LL)
A simplified structure looks like:
Lower Low → Lower High → Lower Low → Lower High
For example:
₹600 → ₹550 → ₹570 → ₹510 → ₹535 → ₹480
Each major high is lower than the previous one, while each major low also moves lower.
What Are Lower Highs?
A Lower High (LH) occurs when a new swing high forms below the previous significant swing high.
What Are Lower Lows?
A Lower Low (LL) occurs when a new swing low forms below the previous significant swing low.
This creates the basic structure of a downtrend.
3. Sideways or Range-Bound Market
Not every market is continuously moving upward or downward.
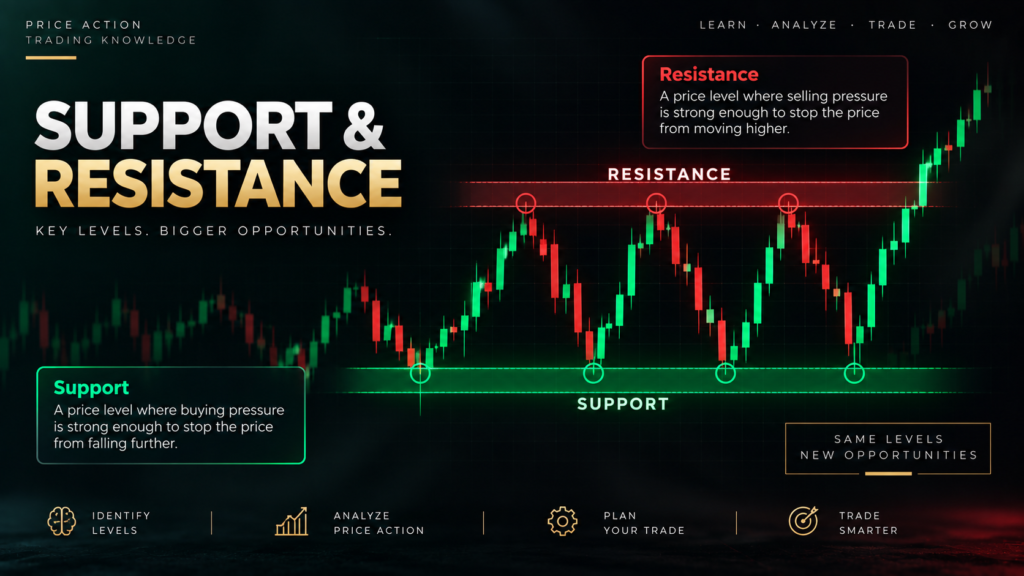
Sometimes price moves between a relatively defined support area and resistance area.
For example:
Resistance → ₹600
Price moves:
₹580 → ₹600 → ₹570 → ₹595 → ₹575 → ₹602 → ₹580
Support → ₹570
This type of movement is often described as a range-bound or sideways market.
During such periods, the market may lack a clearly established directional trend.
What Is Market Structure?
Market structure refers to the way price organizes itself through a sequence of swing highs and swing lows.
Instead of focusing on one candle, market-structure analysis looks at the broader relationship between significant price points.
A simplified framework is:
Bullish Structure
HH → HL → HH → HL
Bearish Structure
LH → LL → LH → LL
Range Structure
Repeated reactions between support and resistance
This framework provides a basic method for describing what price is doing.
Swing Highs and Swing Lows
To understand market structure, you first need to identify swing points.
Swing High
A swing high is a point where price rises and then turns lower.
Swing Low
A swing low is a point where price falls and then turns higher.
These points create the visible peaks and troughs on a chart.
For example:
The relationship between these swing points helps identify the broader market structure.
Trend Continuation
A trend is generally considered to be continuing when price maintains its existing structural pattern.
Uptrend
HH → HL → HH → HL
If price continues creating higher highs and higher lows, the bullish structure remains intact.
Downtrend
LH → LL → LH → LL
If price continues creating lower highs and lower lows, the bearish structure remains intact.
However, markets can change structure at any time. A trend should therefore be viewed as an evolving price condition rather than a permanent state.
What Is a Break of Structure?
A Break of Structure (BOS) generally refers to price moving beyond a significant previous swing point in the direction of the existing trend.
For example, consider an uptrend:
HH → HL → HH → HL
If price moves above the previous Higher High, it may be described as a bullish break of structure.
Similarly, during a downtrend, if price moves below a previous significant low, traders may describe it as a bearish break of structure.
The exact definition of BOS can vary between technical-analysis methodologies, so it is important to define which swing points are considered significant.
What Is a Change in Market Structure?
Sometimes price stops maintaining its previous sequence of highs and lows.
For example:
HH → HL → HH → HL
If price subsequently breaks below an important previous higher low, the existing bullish structure has been weakened.
This does not automatically mean that a complete trend reversal has occurred.
The market may:
- Consolidate
- Move sideways
- Create a deeper correction
- Establish a new trend
- Continue in the original direction
Therefore, a structural change should be examined within the broader context rather than treated as an automatic reversal signal.
Market Structure and Support & Resistance
Market structure and support and resistance are closely related.
Previous swing highs can become important resistance areas, while previous swing lows can become important support areas.
For example:
Higher High → Resistance
Higher Low → Support
When these areas are broken, price may establish new structural levels.
This is why studying market structure alongside support and resistance can provide a more complete picture of price behaviour.
Market Structure Across Different Timeframes
Market structure exists on multiple timeframes.
For example:
| Timeframe | Structure Often Studied For |
|---|---|
| 5-minute | Very short-term price movement |
| 15-minute | Intraday structure |
| 1-hour | Short-term structure |
| Daily | Broader market structure |
| Weekly | Long-term structure |
The structure can be different across timeframes.
A market might look like this:
Weekly → Uptrend
Daily → Uptrend
1-Hour → Downtrend
This does not necessarily represent a contradiction. It simply means the market is moving in different directions over different observation periods.
Why Market Structure Matters
Market structure provides a framework for understanding what price is doing.
It can help in studying:
- Direction of the market
- Trends
- Corrections
- Swing highs and lows
- Breakouts
- Breakdowns
- Support and resistance
- Potential structural changes
- Different timeframe relationships
Most importantly, it shifts the focus from predicting every individual candle to understanding the sequence of price movements.
Common Mistakes Beginners Make
1. Treating Every Small Move as Market Structure
Not every minor fluctuation represents a meaningful swing point.
2. Ignoring the Timeframe
A structure that appears significant on a 5-minute chart may be relatively insignificant on a daily chart.
3. Assuming Every Break Is a Reversal
A break of one swing point does not automatically establish a new trend.
4. Focusing Only on Individual Candles
A single bullish or bearish candle provides limited information without considering the surrounding structure.
5. Drawing Too Many Swing Points
Overanalysing every minor high and low can make a chart unnecessarily complicated.
A Simple Way to Read Market Structure
When looking at a chart, ask four basic questions:
1. Where are the significant swing highs?
2. Where are the significant swing lows?
3. Are the highs getting higher or lower?
4. Are the lows getting higher or lower?
From there, you can begin to classify the market:
Higher Highs + Higher Lows → Uptrend
Lower Highs + Lower Lows → Downtrend
No clear progression → Range/Consolidation
This simple framework forms the foundation for more advanced price-action analysis.
Pingback: 3. Understanding Trading Behaviour - candletheory.space